Tramontana
Which way the market is moving on your Renko chart, and how strongly: one score from −100 to +100, with a suggested stop that follows the trend.
An indicator for the ATAS platform, built and tested on Nasdaq-100 futures.
Tramontana is coming soon. Tramontana Lite, a simpler version, is free now.
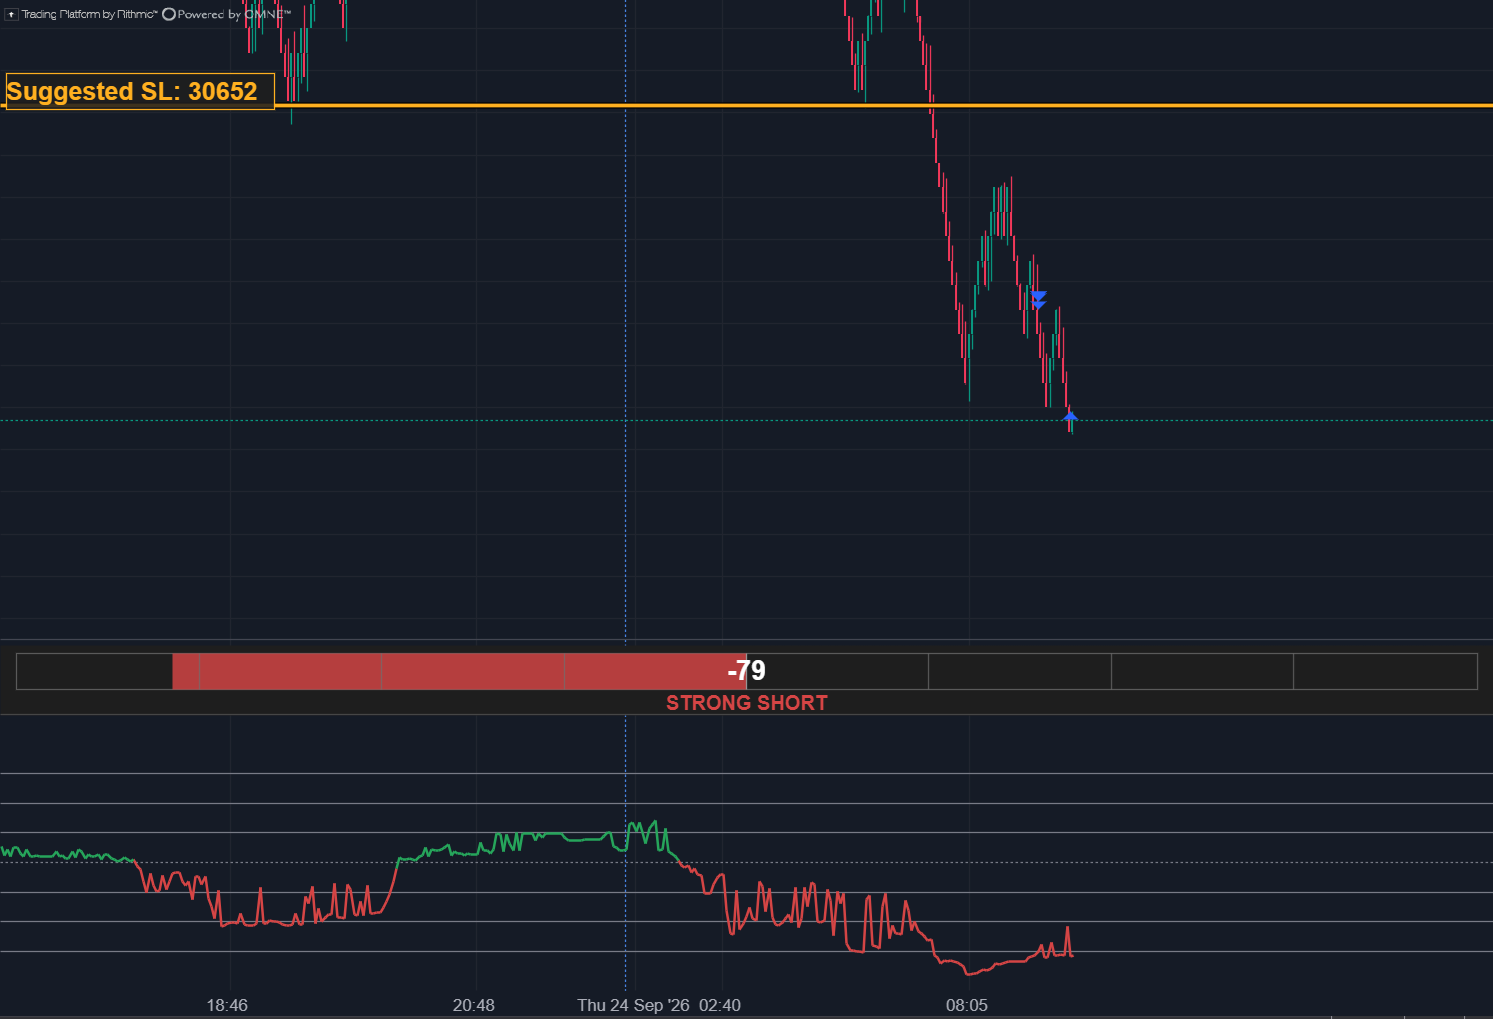
- Orange line: the suggested stop.
- Bar under the chart: the score and its zone.
- Line at the bottom: the score history.
NQ, Renko 30, 24 September 2026. A selected trade, not a typical result. The zone names have changed since this screenshot: STRONG SHORT is now STRONG DOWNTREND.
What it shows
The score
A number from −100 to +100, in a bar along the bottom of the chart. It says which way the market is moving and how strongly: above zero up, below zero down. The bar fills from the centre toward that side.
- STRONG DOWNTREND−100 to −75
- DOWNTREND−75 to −50
- WEAK DOWNTREND−50 to −25
- NEUTRAL−25 to +25
- WEAK UPTREND+25 to +50
- UPTREND+50 to +75
- STRONG UPTREND+75 to +100
Under the bar, the zone names the move. It changes only when a brick closes.
The suggested stop
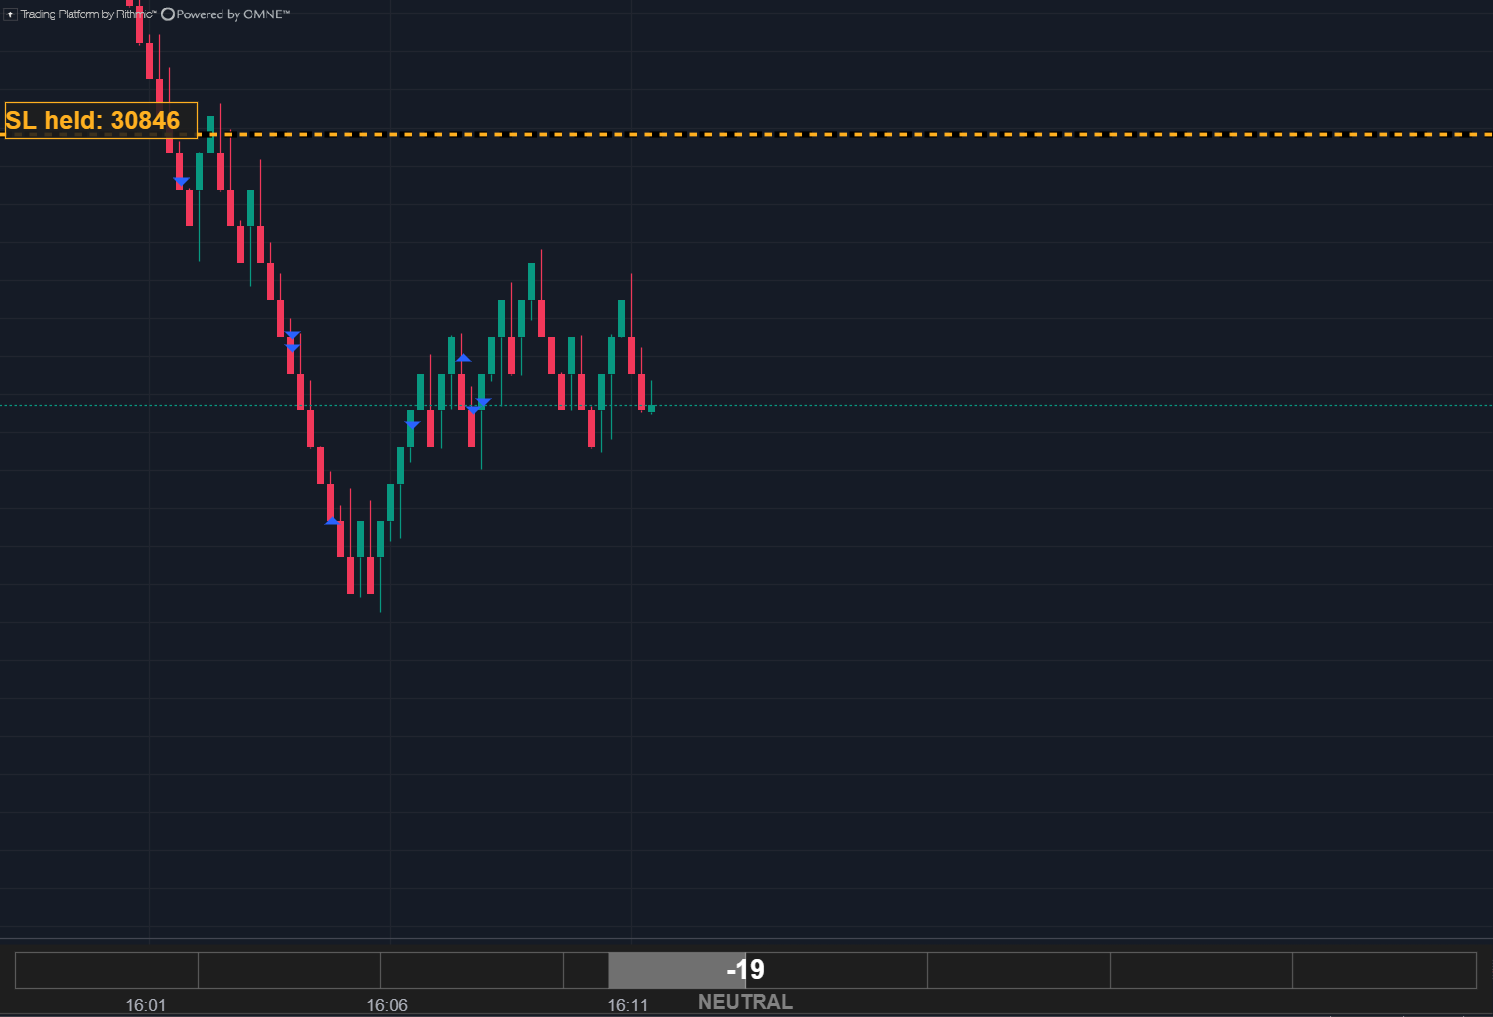
An orange line with its price: above the market when the score points down, below it when the score points up. It follows the trend as it goes on, and it appears only when the reading is clear. Once drawn, it doesn’t vanish when the reading fades: it turns dashed, labelled SL held, and stays until price breaks it.
The score history
Under the chart, a line with the score of every brick: green above zero, red below. One look tells you how long the market has held its direction, and how firmly.
When to stand aside
When conditions aren’t right for a trade, NO TRADE or TRADE NOT RECOMMENDED takes the place of the zone. No stop is suggested and the alerts stay silent.
Pullbacks and alerts
When a pullback in a trend comes to an end, an arrow marks that brick on the panel and PULLBACK LONG or PULLBACK SHORT appears for one brick, with its own sound. A new suggested stop has a sound too.
Examples from my trading
Trades from my own NQ charts (Renko 30), September and October 2026, chosen because they show Tramontana clearly. Order tags, profit figures, account details and a few unrelated screen elements have been removed; the bricks and Tramontana are as they were on screen.
In these screenshots the zones still have their earlier names: STRONG SHORT is now STRONG DOWNTREND, MODERATE LONG is UPTREND and WEAK LONG is WEAK UPTREND.
One short, three moments: 22 September 2026
-
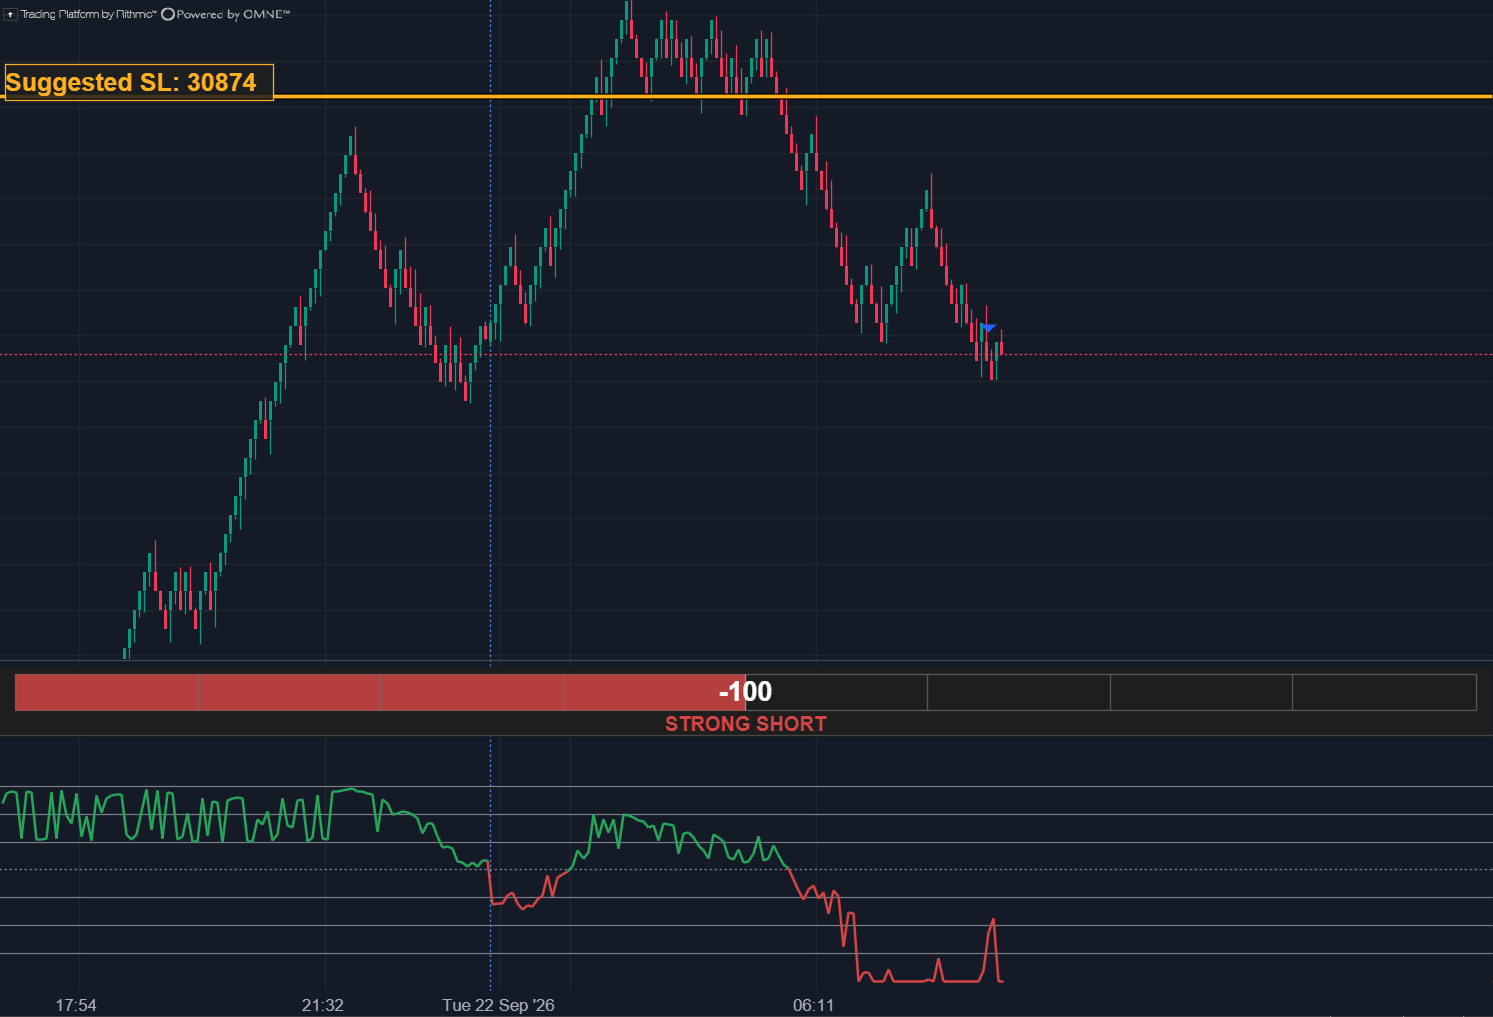
Just after the entry. The score is −100 and the suggested stop is at 30874. At the bottom, the score history turned red as price came off the high. -
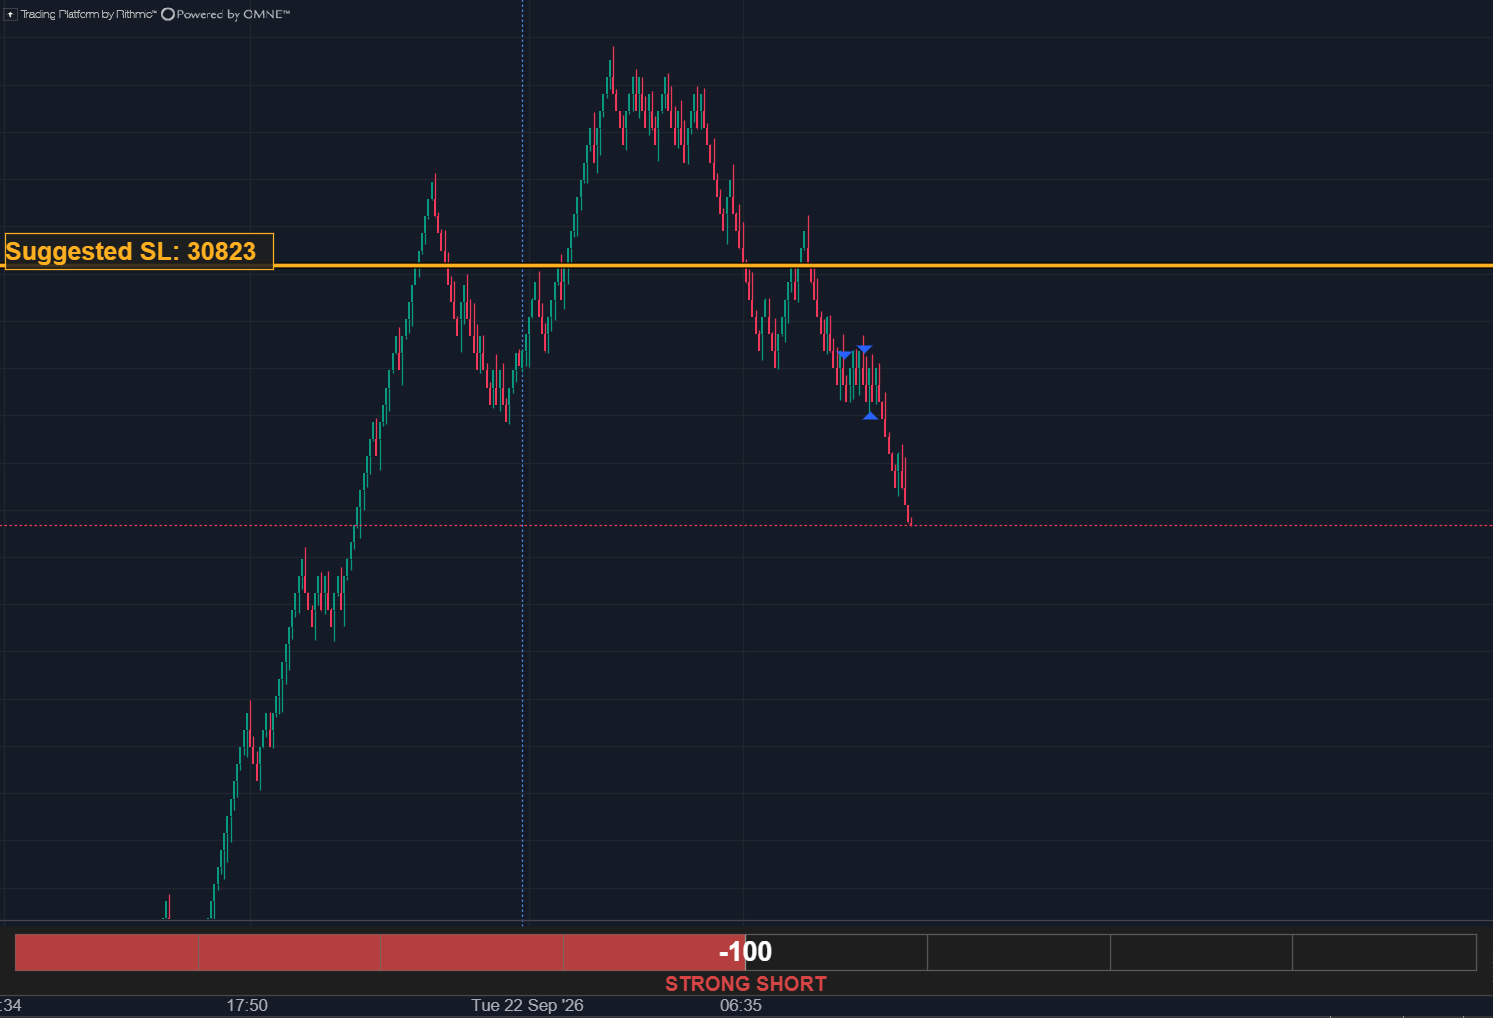
During the move. The score is still −100, and the suggested stop has come down to 30823. -
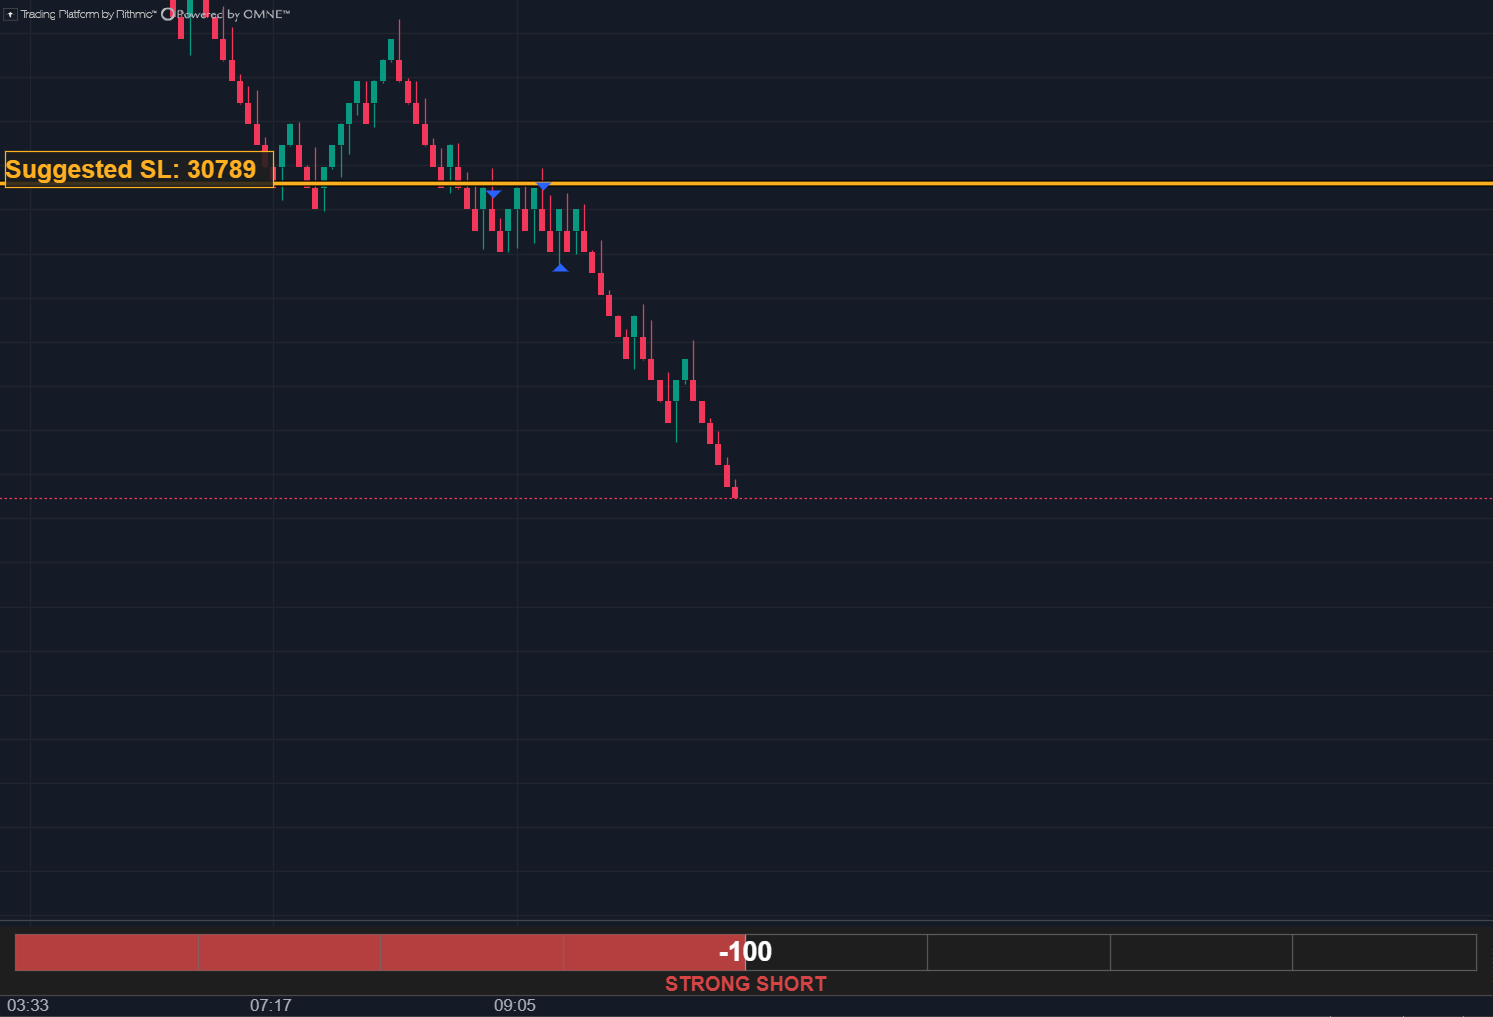
At the end of the move, about 100 points below the entry. The score is still −100, and the suggested stop is at 30789, 85 points lower than at the start.
Two longs
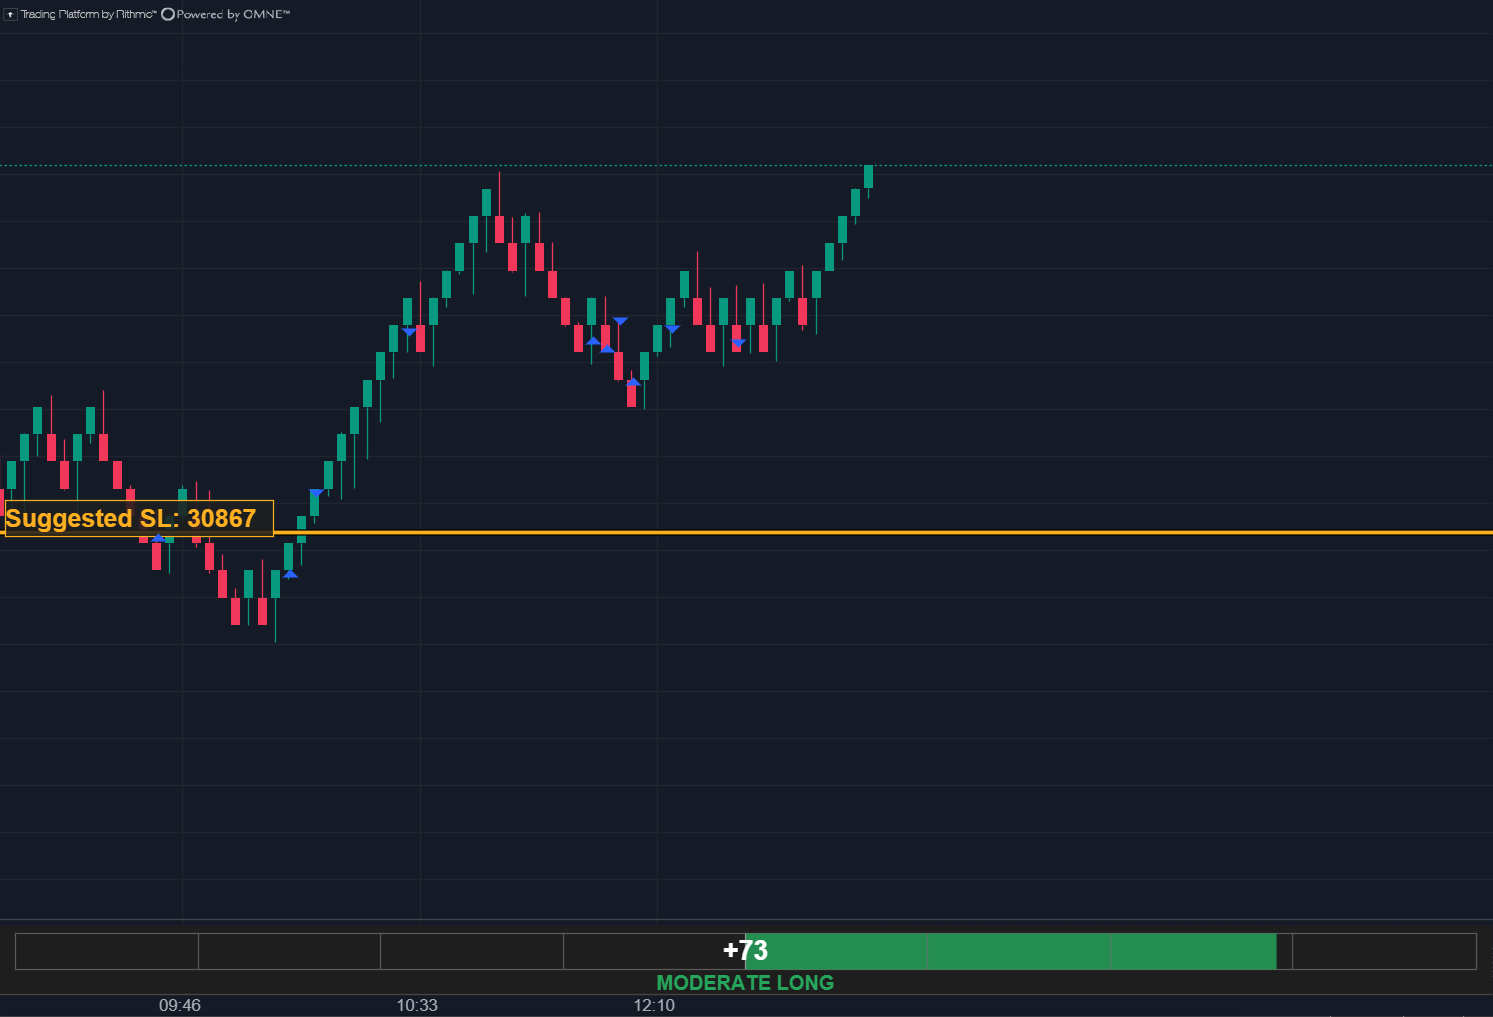
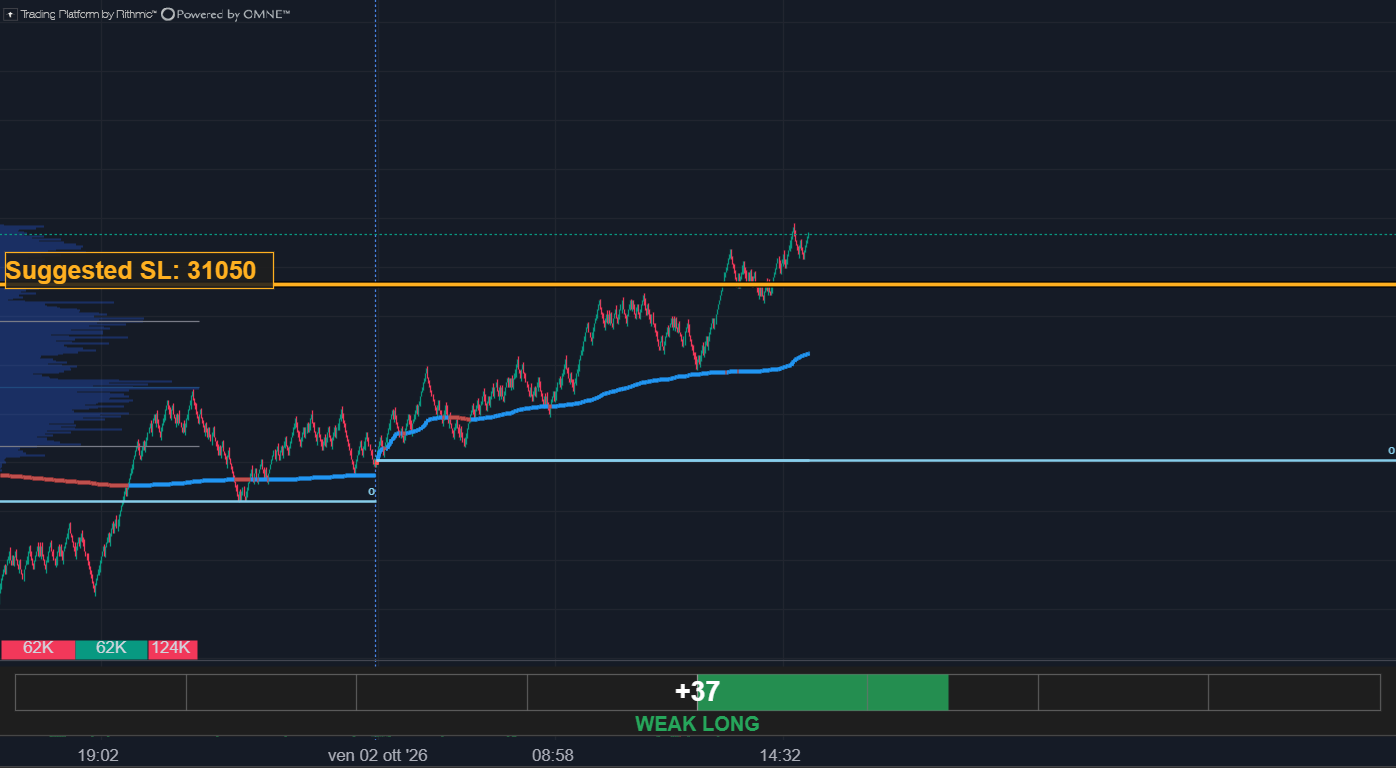
When the reading fades
Made for Renko charts
Renko only
Tramontana was set and tested on Renko charts and is made for them, not for time-based candles.
Read on the closed brick
The zone, the stop and the signals are decided when a brick closes, so they don’t change while a brick is forming. The number and the bar are live.
Set up for each instrument
Tramontana is calibrated instrument by instrument. It was developed and tested on Nasdaq-100 futures (NQ and MNQ); other instruments will come with new releases, as the data comes in.
Coming soon
Tramontana will be available through ATAS soon. The price will be announced at launch, and the people on the list will hear first.
Tell me when it’s availableFree: Tramontana Lite
A simpler version you can use today, at no cost. It shows one state under your Renko chart: bullish, bearish or neutral. No score, no zones, no stop and no signals: those are what Tramontana adds.
-
Have ATAS
Tramontana Lite runs inside the ATAS platform. No ATAS yet? Start the free ATAS trial.
That’s a referral link: if you buy an ATAS licence after using it, I receive a commission. Your price stays the same.
-
Ask for access
Fill in the short form with the email address of your ATAS account: access is linked to that account. A copy of your request arrives at that address, so you know it’s the right one.
Get Tramontana Lite freeYou get access within 48 hours, and an email from me when it’s on.
-
Add it to a Renko chart
Once you have my email, restart ATAS: it downloads the indicator when it starts. Open the indicators window with Ctrl+I, choose Custom Indicators and add Tramontana Lite to a Renko chart.
Questions, before or after? Write to newhorizons2035@gmail.com, in English or Italian.
Questions
When will Tramontana be available, and at what price?
Soon, through ATAS. The price will be announced at launch. Join the list and you’ll hear first.
Does it tell me when to buy or sell?
No. It describes the move in progress: which way, how strongly, and where a stop could go. Whether to trade, when, and with how much, stay your decisions.
Are the trades on this page typical?
No. I chose them because they show the indicator clearly. They aren’t a record of results and don’t show what you would earn: many trades don’t go like these.
Which instruments does it work on?
Nasdaq-100 futures (NQ and MNQ), on Renko charts: that’s where it was developed and tested. Tramontana is calibrated instrument by instrument, and other instruments will come with new releases.
Does it repaint?
The zone, the stop line and the signals are read on the closed brick, so they don’t change while a brick is forming. The score number and the bar are live: they move with the brick in progress.
I asked for Tramontana Lite. What happens next?
A copy of your request arrives at the address you entered. If it doesn’t come within a few minutes, look in the spam folder, then check the address and send the form again. When your access is on, I write to you: restart ATAS, open the indicators window (Ctrl+I) and look under Custom Indicators. Still missing? Write to newhorizons2035@gmail.com.
How do I get help?
Write to newhorizons2035@gmail.com, in English or Italian.
Why Tramontana
Tramontana is the north wind of the Mediterranean. On old compass roses the north point was marked with a T, for Tramontana: it’s the T in the logo.
I’m Roberto, a futures trader from Italy. Tramontana is the indicator I built for my own NQ Renko charts, and the one on every screenshot on this page.